Why Monitoring Needed More Than Just Metrics
Setting up monitoring isn't just about collecting CPU or memory usage.
That only tells part of the story.
What really matters is:
- Are services actually running?
- Are messages flowing correctly?
- Are failures visible before users notice?
So instead of stopping at infrastructure monitoring, I extended it to include service-level visibility.
The Initial Setup
The monitoring stack was already deployed on one node:
- Prometheus for metric collection
- Grafana for visualization
- Node Exporter for system metrics
At this stage, we had visibility into:
CPU usage
Memory usage
Disk I/O
Network traffic
Filesystem stats
This confirmed that infrastructure monitoring was working correctly.
Extending Monitoring to Multiple Nodes
The next step was to include both SMSC nodes.
Prometheus was configured with separate jobs for each:
- job_name: "smsc-primary-node"
  static_configs:
    - targets:
      - "10.0.1.10:9100"

- job_name: "smsc-secondary-node"
  static_configs:
    - targets:
      - "10.0.1.11:9100"
This allowed a single Prometheus instance to collect metrics from both systems.
Introducing Service-Level Monitoring
Infrastructure metrics are useful, but they don't answer:
Is SMS traffic working?
Are containers healthy?
Are transactions succeeding?
To solve this, I integrated a custom metrics exporter that exposed application-level data in Prometheus format.
The Custom Metrics Endpoint
A local metrics endpoint was exposed on the SMSC host:
curl http://localhost:9097
This returned structured Prometheus metrics like:
smsc_transactions_total
smsc_transactions_per_second
smsc_docker_container_status
smsc_service_status
This gave visibility into:
- Transaction counts
- TPS (throughput)
- Container health
- Service and provider states
- Message queue health signals
- Delivery report statistics
What This Changed
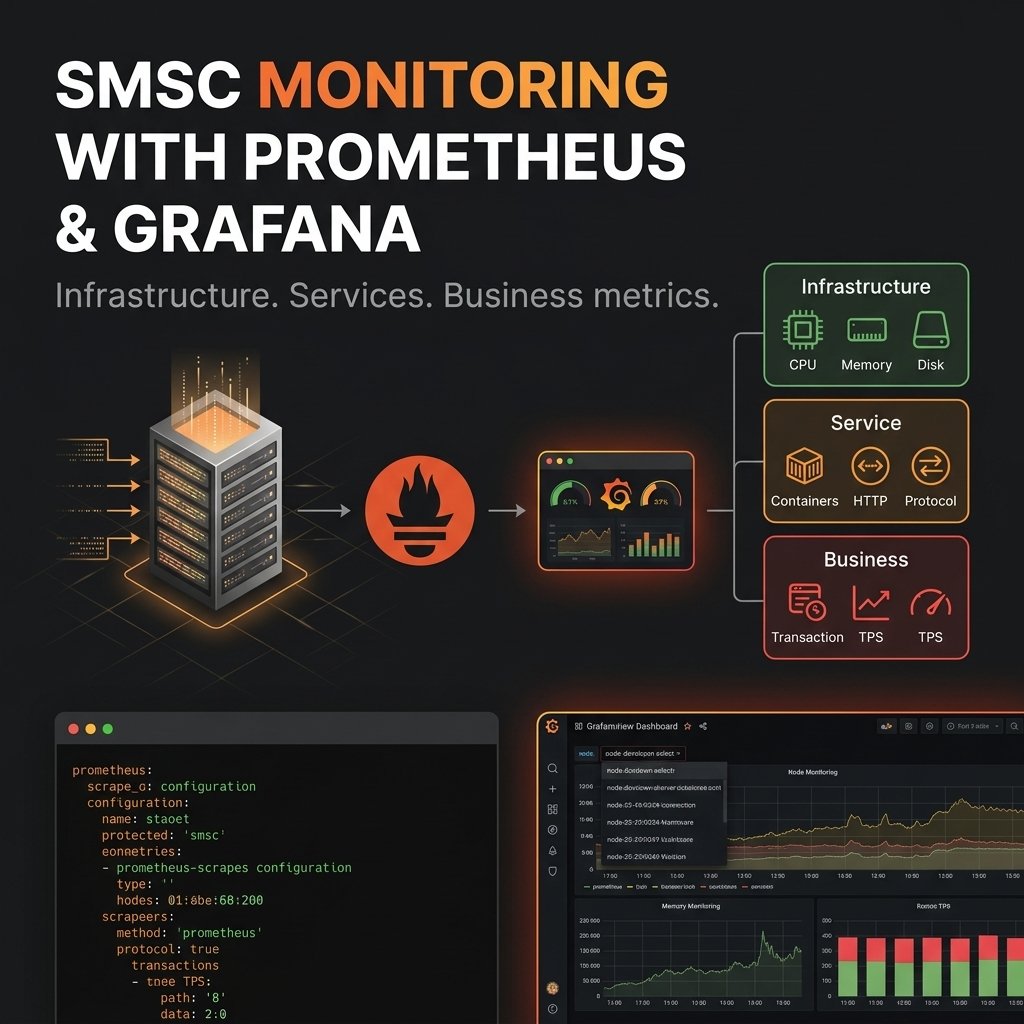
Instead of just system metrics, we now had:
Infrastructure view   → CPU, memory, disk
Service view          → containers, SMPP, SS7, message queues
Business view         → transactions, TPS, delivery stats
That shift made dashboards significantly more useful.
Verifying the Metrics
To confirm everything was wired correctly:
grep -o 'smsc-[a-b]' output.pro | sort -u
This validated that node labels were correctly being exported:
smsc-b
Then checking the endpoint:
curl http://localhost:9097
Confirmed:
- Metrics are exposed
- Labels are correct
- Prometheus can scrape them
Building Grafana Dashboards
With metrics available, dashboards were created for:
1. Infrastructure Panels
- CPU usage
- Memory usage
- Disk utilization
- Network traffic
2. Container Monitoring
smsc_docker_container_status
This shows whether each container is:
1 → Running
0 → Down
3. Transaction Monitoring
smsc_transactions_total
smsc_transactions_per_second
Used to track:
- Success vs failure
- Real-time TPS
4. Service & Protocol Status
smsc_service_status
Covers:
- SMPP connections
- SS7 gateway state
- External integrations
5. Message Queue & System Health Signals
smsc_queue_oom_error
Helps detect internal system stress before failures escalate.
Avoiding Duplicate Dashboards
Initially, dashboards were tied to a single node.
That would have required duplicating everything for the secondary SMSC.
Instead, I implemented a Grafana variable:
Node Variable
smsc-a
smsc-b
Then replaced queries like:
smsc_docker_container_status{node="smsc-a"}
With:
smsc_docker_container_status{node="$Node"}
Why This Matters
This small change enabled:
One dashboard → Multiple nodes
Instead of maintaining two dashboards:
Dashboard duplication ❌
Dynamic filtering     ✅
Now switching nodes is just a dropdown selection.
Key Takeaways
- Monitoring should go beyond infrastructure
- Service-level metrics provide real operational visibility
- Custom exporters unlock deeper insights than Node Exporter alone
- Label-based filtering is critical for scalability
- Grafana variables prevent dashboard duplication
What This Setup Achieves
Single monitoring platform
        ↓
Multi-node visibility
        ↓
Service-level observability
        ↓
Actionable dashboards
What I'd Improve Next
- Add alerting rules (CPU thresholds, failure rates, TPS drops)
- Define thresholds for message queue and SMPP health
- Add historical trend panels
- Integrate with external alerting systems like PagerDuty or Slack
Final Thought
Monitoring becomes powerful when it answers:
"Is the system just running — or actually working?"
This setup moves closer to answering that reliably.