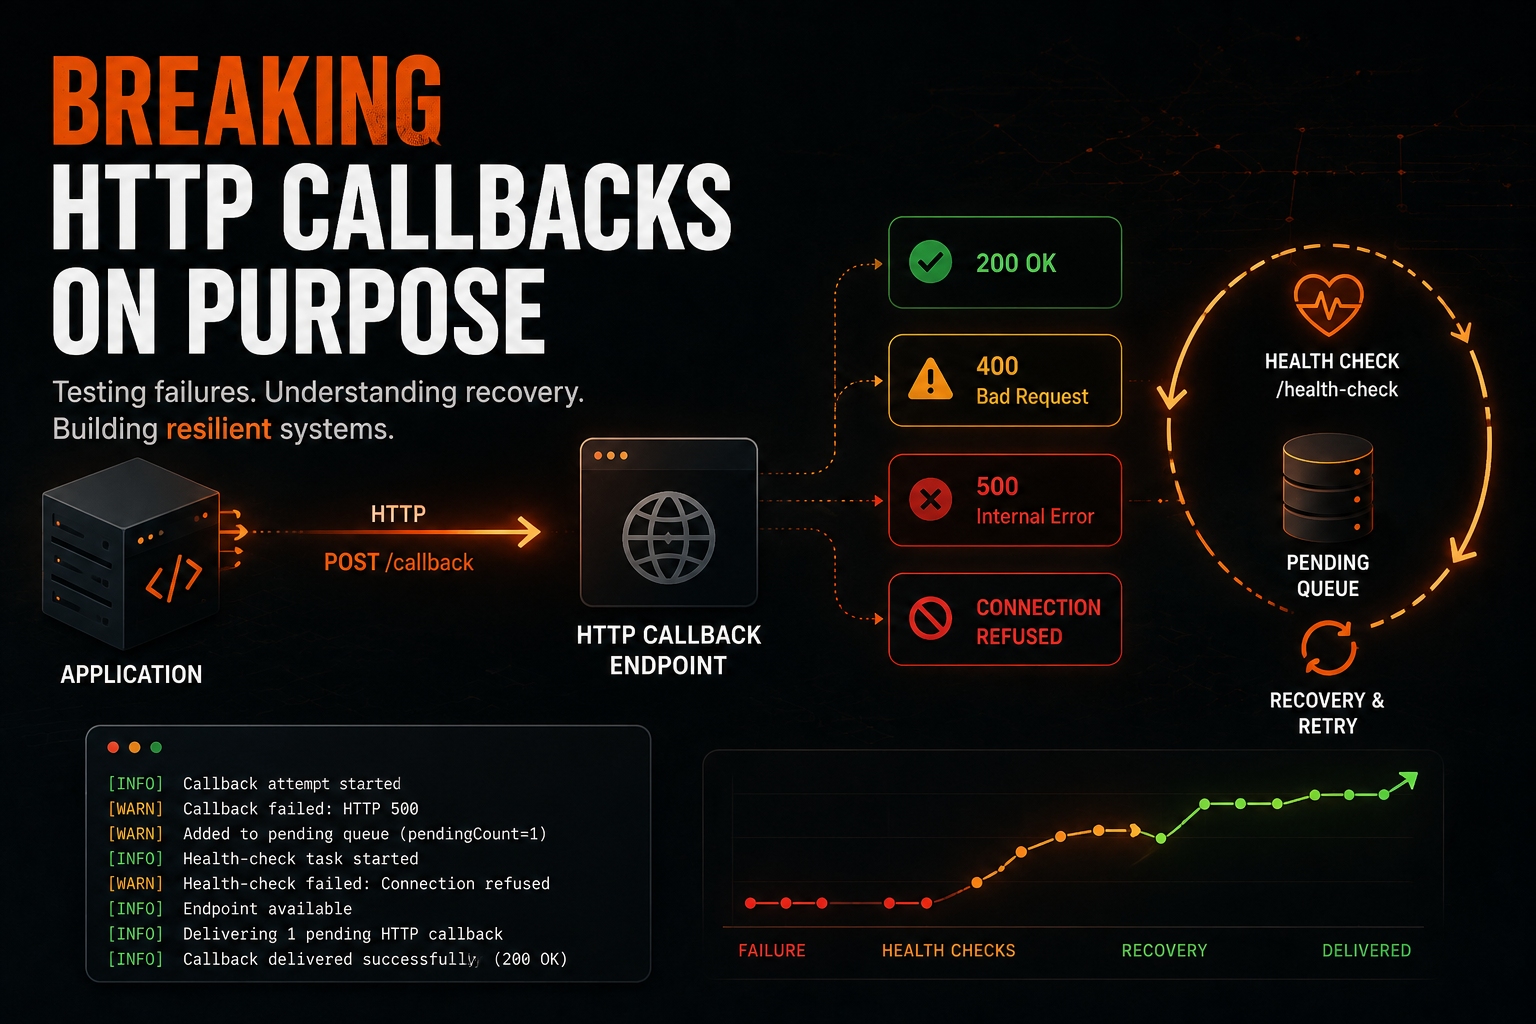
Why Break Something That Already Works?
Today I spent most of my time validating how an asynchronous HTTP callback flow behaves when the receiving endpoint becomes unhealthy.
The happy path was simple:
Event generated
    ↓
HTTP callback sent
    ↓
Endpoint returns 2xx
    ↓
Delivery completed
But a successful request doesn't tell you much about resilience.
The interesting questions start when the endpoint stops behaving normally:
- What happens when it returns HTTP 400?
- What happens when it returns HTTP 500?
- What happens when nothing is listening on the port?
- What happens when the endpoint responds too slowly?
- Is failed work preserved?
- How does the application know the endpoint has recovered?
- Does pending work resume automatically?
So instead of testing only the happy path, I deliberately broke the callback endpoint in several different ways.
The Test Setup
I used a small controllable HTTP callback server that could change its behaviour while the application was running.
The basic flow looked like this:
Application
    │
    │ POST /callback
    ▼
Test HTTP Server
    │
    ├── 200 OK
    ├── 400 Bad Request
    ├── 500 Internal Server Error
    └── Delayed response
The same server exposed a separate health endpoint:
GET /health-check
This allowed callback delivery and endpoint health to be controlled independently.
That turned a simple HTTP server into a small fault-injection tool.
Establishing the Baseline
Before testing failures, I first confirmed the healthy path.
The callback endpoint returned HTTP 200 and the application successfully completed delivery.
A simple request can verify an endpoint directly:
curl -v http://localhost:5001/health-check
Using -v is useful because it shows more than the response body. It also exposes connection attempts and HTTP response details.
Once the baseline worked, I started breaking things.
Failure #1: HTTP 400
First I configured the callback endpoint to return:
HTTP 400 Bad Request
The server itself was reachable, but the callback was rejected.
This distinction matters:
TCP connection     ✓
HTTP server        ✓
Request processed  ✓
Successful result  ✗
The application detected the failed callback and preserved the pending work instead of treating it as successfully delivered.
Failure #2: HTTP 500
Next I returned:
HTTP 500 Internal Server Error
Again, connectivity was fine.
The difference was that the remote application was now reporting a server-side failure.
400 → reachable endpoint, request rejected
500 → reachable endpoint, server failed
Both are HTTP failures, but neither should be confused with a network failure.
Failure #3: Connection Refused
Then I stopped the callback server completely.
A direct test immediately showed:
Connection refused
For example:
curl -v --connect-timeout 3 http://localhost:5001/health-check
This failure happens before an HTTP response exists.
Conceptually:
HTTP 400 / 500

Application → TCP → HTTP Server → HTTP Error


Connection Refused

Application → TCP → ✗
This became one of the most useful lessons from the testing session.
When an application reports an HTTP integration problem, I shouldn't immediately assume the application itself is broken.
First, test the dependency directly.
Health Checks and Pending Work
Once callback delivery failed, the application started checking whether the endpoint had recovered.
The behaviour looked roughly like:
Callback fails
    ↓
Work stored temporarily
    ↓
Health-check task starts
    ↓
GET /health-check
    ↓
Still unhealthy?
    ↓
Wait
    ↓
Check again
While the endpoint remained unavailable, health checks continued periodically.
The important part was that the failed work wasn't immediately lost.
It remained pending while endpoint availability was checked independently.
Testing Multiple Pending Requests
I also wanted to know what happened when more work arrived while recovery was already running.
Instead of failing one callback, I generated several while the endpoint remained unhealthy.
The pending count increased:
pendingCount=1
pendingCount=2
pendingCount=3
But the system didn't need an independent health-check loop for every failed callback.
Conceptually:
Failed callback #1 ─┐
Failed callback #2 ─┼── Pending work
Failed callback #3 ─┘
                         │
                         ▼
                  One health-check flow
This is much more efficient than every pending item independently polling the same broken endpoint.
Recovering the Endpoint
Breaking the endpoint was only half of the test.
The important part was proving recovery.
I restored the test server so that:
GET /health-check → 200
POST /callback    → 200
The next health check detected that the endpoint was available again.
The flow then became:
Health check → 200
       ↓
Endpoint marked healthy
       ↓
Health-check loop stops
       ↓
Pending work retrieved
       ↓
Callbacks retried
       ↓
Successful delivery
Watching the same request move from failure, to pending state, to successful redelivery made the recovery mechanism much easier to understand than simply reading its configuration.
Testing Slow Responses
Another failure mode I experimented with was a deliberately slow callback.
The test server could delay its response:
if callback_delay > 0:
    time.sleep(callback_delay)
I configured a 30-second delay and submitted another callback.
The request eventually returned HTTP 200.
Interestingly, the application did not classify the 30-second delay as a timeout.
That was useful information by itself.
It meant I couldn't simply assume:
30 seconds = timeout
The actual HTTP client timeout could be higher.
The correct next step is to determine the configured client timeout before increasing the delay and claiming that timeout recovery has been validated.
This was a good reminder that a test should prove a condition actually occurred, not just that I attempted to create it.
Building a Small Fault-Injection Tool
One of my favourite parts of this exercise was using a tiny HTTP server to simulate different external-system behaviours.
Instead of modifying the application under test, I controlled its dependency.
For example:
curl -X POST http://localhost:5001/control/callback/200
curl -X POST http://localhost:5001/control/callback/400
curl -X POST http://localhost:5001/control/callback/500
The health endpoint could be controlled independently:
curl -X POST http://localhost:5001/control/health/200
curl -X POST http://localhost:5001/control/health/400
curl -X POST http://localhost:5001/control/health/500
And response latency could be introduced deliberately:
curl -X POST http://localhost:5001/control/callback-delay/30
Then reset:
curl -X POST http://localhost:5001/control/callback-delay/0
This is a technique I want to reuse.
When testing integrations, a controllable fake dependency can make difficult failure conditions easy to reproduce.
Following Docker Logs Without Drowning in Them
Another thing I practised was narrowing large application logs down to the behaviour I cared about.
For example:
docker logs --since 3m http-server 2>&1 | \
grep -Ei 'timeout|pending|health check|failed|error'
There are several useful pieces here:
--since 3m   → only recent logs
2>&1         → combine stderr and stdout
grep -E      → extended pattern matching
grep -i      → case-insensitive matching
For live monitoring:
docker logs --tail 300 -f http-server 2>&1 | \
grep -Ei 'health.?check|pending|callback|failed'
When filtering hid too much information, I went back to the raw logs:
docker logs --since 10m http-server 2>&1 | tail -150
That last point matters.
grep makes troubleshooting faster, but an incorrect search pattern can make it look like nothing happened.
When filtered logs don't make sense, inspect the unfiltered context.
Checking Whether Something Is Actually Listening
When I encountered connection-refused errors, checking the listener itself was more useful than repeatedly retrying the application.
On modern Linux systems:
sudo ss -lntp
To check a particular port:
sudo ss -lntp | grep 5001
An older alternative is:
sudo netstat -tulpn
The troubleshooting sequence becomes:
Application reports connection failure
            ↓
Test endpoint directly with curl
            ↓
Check whether port is listening
            ↓
Check callback process
            ↓
Check application logs
This is much faster than randomly restarting services.
Correlating Multiple Views
One thing that made this testing much easier was keeping multiple views open at the same time.
One terminal showed the callback server:
POST /callback
GET /health-check
Another showed application logs:
callback failed
pending work stored
health check started
endpoint recovered
pending work delivered
A third terminal was used to change the test conditions and send requests.
This gave me a useful debugging pattern:
Action
  ↓
External observation
  ↓
Internal application observation
Instead of relying on a single log message, I could correlate what I changed with what both sides observed.
What I Broke
During this session I intentionally created:
- HTTP 400 callback failures
- HTTP 500 callback failures
- unhealthy health-check responses
- connection-refused failures
- multiple callbacks while the endpoint was unavailable
- delayed callback responses
- recovery-disabled behaviour
- endpoint stop/start conditions
The goal wasn't just to make requests fail.
For every failure I wanted to answer three questions:
- Did the application detect it?
- Did it preserve the correct state?
- Did it recover correctly afterward?
What I Learned
The biggest lesson was that testing resilience requires more than proving the happy path.
A better validation pattern is:
Establish healthy baseline
        ↓
Inject a controlled failure
        ↓
Observe failure detection
        ↓
Verify internal state
        ↓
Keep the failure active
        ↓
Observe behaviour over time
        ↓
Restore the dependency
        ↓
Verify automatic recovery
        ↓
Confirm pending work completes
I also got much more comfortable distinguishing between different HTTP failure modes:
HTTP 4xx
→ endpoint reachable, request unsuccessful

HTTP 5xx
→ endpoint reachable, remote server unsuccessful

Connection refused
→ TCP connection couldn't be established

Timeout
→ connection/request exists, response didn't arrive within the client's limit
These differences matter because each points troubleshooting in a different direction.
The Most Useful Lesson
The most useful thing I built today wasn't the callback server itself.
It was a repeatable way to answer:
What happens when this dependency breaks?
Instead of waiting for failures to happen naturally, I could create them on demand, observe the application's state, restore the dependency, and verify recovery.
That turns troubleshooting into an experiment rather than guesswork.
And that's something I can reuse far beyond HTTP callbacks.